Data Studio
A SQL editor with diagnostics, plus ready-made visuals with receipts.
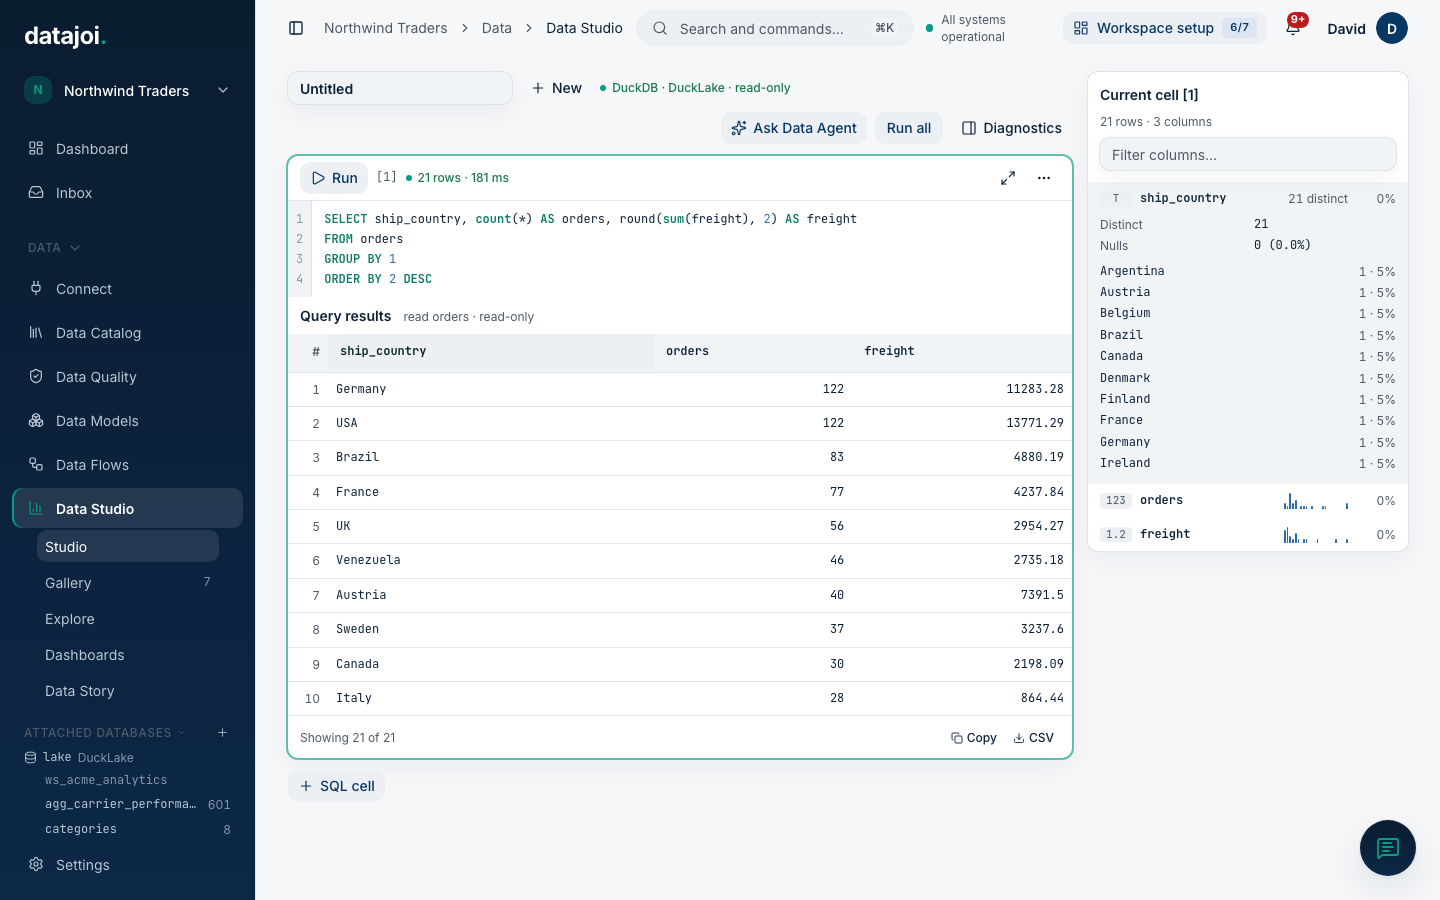
#Studio
A classic SQL editor over your lake. Cells have line numbers and highlighting; ⌘↵ runs. Results appear in a grid you can copy as TSV or download as CSV. The Diagnostics pane describes every returned column (type, a small distribution, distinct count, null rate) and expands to top values, a histogram or a date span. It is computed from the rows already returned, so it costs no extra query.
The attached databases tree in the sidebar lists the lake and its tables; click one for a summary, double-click to query it. Ask Data Agent drafts a SQL cell you can read and edit. Save as model sends a cell to Experiments.
#Gallery, Explore, Dashboards, Data Story
Ready-made cards that each run a real question and show their receipt: source model, row count, the definition used and when it refreshed. If the totals of two cards disagree, a banner says so and links to the definition.